Modelling UK Income Distribution
I wanted to evaluate the Labour Party’s proposed tax system so I started by searching for an income distribution model, I first came across this paper by Johan Fellman which lists a few models and compares them, it also references this paper by Duangkamon Chotikapanich which isn’t open access but the document can be retrieved if you have acess through a school, university or some academic institution. In his paper, Chotikapanich presents a single-parameter model which I fit using non-linear least squares. The equation for his model is
$$\frac{e^{kp}-1}{e^k-1}$$
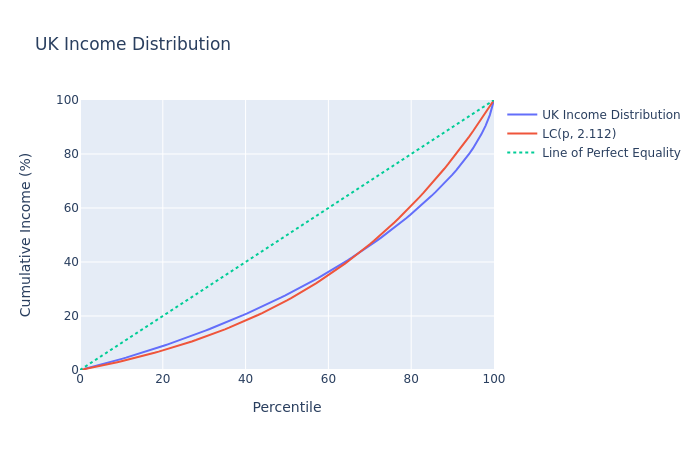
For the UK’s income distribution, I use the 2017-2018 data from the ONS, however the data only goes up to the 99th percentile, so I assume that the top 1% don’t exist, this obviously isn’t completely accurate since the top 1% do in fact exist. However, I don’t want to modify or add anything extra to the data. After fitting the data to the model I get k≈2.112 (3 s.f) which on a graph looks like this

As a test for the model, I calculate the Gini coefficient using it which is equal to
$$\frac{(k-2)e^k+k+2}{k(e^k-1)}$$
Using the value for k from earlier I get the Gini coefficient as 32.8% (3 s.f). The ONS reports that for the financial year ending 2018, the Gini coefficient is 32.5% so it appears as if the model works relatively well for this.
The Gini coefficient is a measure of inequality ranging from 0 to 1 where 0 would represent an economy where everybody earns the same amount of money and 1 would represents an economy where one person earns all the money and everybody else earns nothing at all. It can also be represented as a percentage from 0% to 100%. Most developed countries tend to have a Gini coefficient between 0.3 and 0.5.
As a separate activity that doesn’t make use of the model, I was able to work out an estimate for the mean income for the first 99% of tax payers using the equation
$$\text{MeanIncome} = \frac{\text{CumulativeIncome}}{99}$$
Where CumulativeIncome is the result from adding up the incomes from the people at the top of each percentile. The number 99 comes from the number of groups (percentiles) that the data data is split up into. I calculate the CumulativeIncome using the income distribution data published by the ONS. This results in a mean income of £31,500 (3 s.f). The ONS reports a mean income of £34,200 which is slightly higher than mine and that’s probably due to fact that I wasn’t able to get data for the top 1%.
Mean income on its own isn’t very representative of the income in an economy since it’s easily skewed by extreme values and a better measuer would be the median income. However, calculating the mean income was a quick way to make sure that everything was working well.
The IFS has also published this which details the current tax system and the Labour party’s proposed tax system. Using this model of income distribution, I can now work out an estimate for how much money the Labour Party’s tax plan would raise.
Both the Labour Party and the IFS understand that certain people are able to avoid paying taxes by changing their income or evading taxes and they represent this using a measure called Taxable Income Elasticity. In order to further evaluate Labour’s proposed tax plan, I’ll most likely have to learn how to use that which might be a fun activity and will also teach me something new.
References
- Modelling Lorenz Curve, John Fellman
- A comparison of alternative functional forms for the Lorenz curve, Duangkamon Chotikapanich
- Percentile points from 1 to 99 for total income before and after tax, the Office for National Statistics
- Number of individual income taxpayers, The Office for National Statistics
- Household income inequality: Financial year ending 2018, The Office for National Statistics
- Average household income: Financial year ending 2018, The Office for National Statistics
- Labour’s proposed income tax rises for high-income individuals, The Institute for Fiscal Studies