Modelling Language Change with an S-shaped Curve
About a year ago I was reading a paper titled “Empirical foundations for an integrated study of language evolution” which contained a graph that captured my eye.
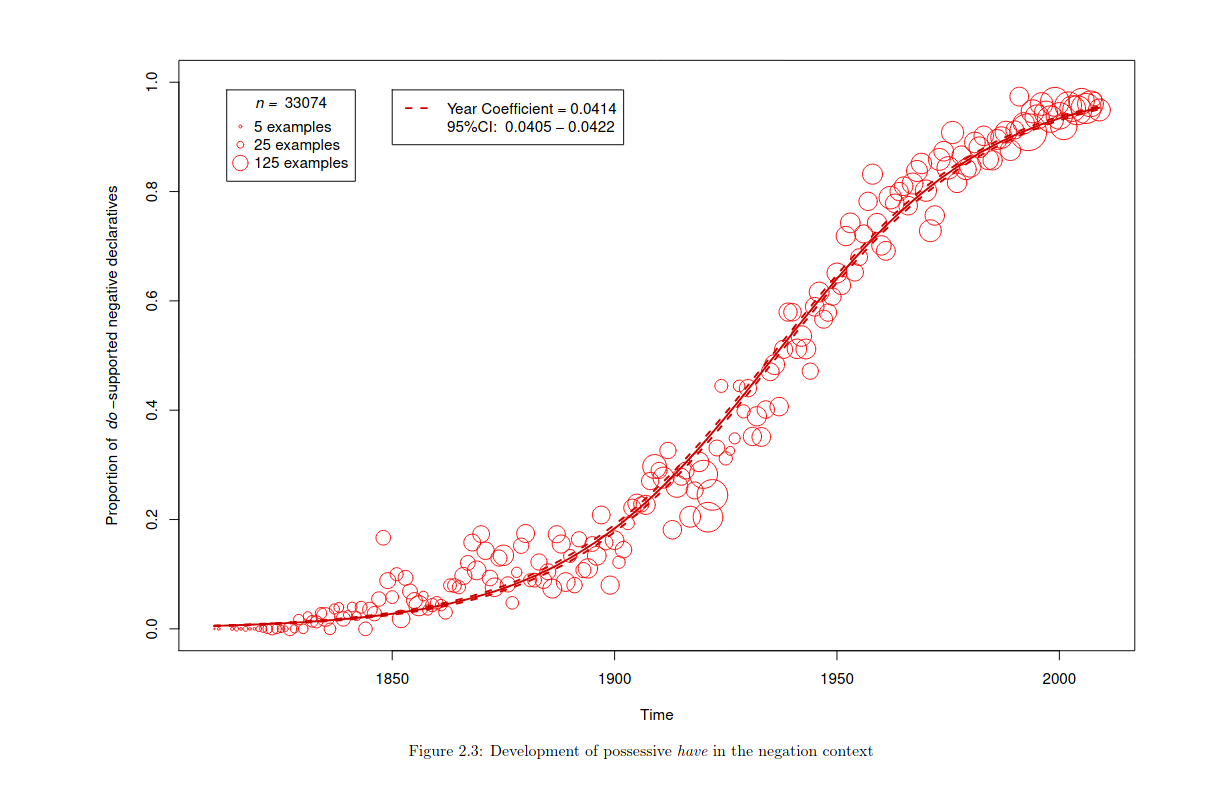 The graph comes from Zimmerman’s thesis titled “Formal and quantitative approaches to the study of syntactic change” and shows the how the possessive ‘have’ has changed over time. Zimmerman created the graph by taking data from COHA (Corpus of Historical American English).
At the beginning of his paper, Zimmerman outlines a model for language change which charectarises language change as consisting of 3 periods.
$$\alpha \quad \to \quad \{\quad\alpha\quad|\quad\beta\quad\} \quad \to \quad \beta$$ Zimmerman calls the first period the “conservative period” where speakers will only use the conservative variant shown here as ‘α’, the next period is called the transitional period where speakers will use both the conservative variant and the new ‘innovative’ variant denoted here as ‘β’, from here the language enters the innovative period where speakers will only make use of the innovative variant. Zimmerman says that the logistic sigmoid function can be used to model this which he himself later does in the paper. The logistic sigmoid outlines a probability distribution ranging from 0 to 1 and the function represents the probability that a speaker will use a certain variant.
When I initially saw this I wanted to reproduce it but made a mistake collecting the data and forgot to specify that ‘have’ should be followed by a noun-phrase to restrict the results to the possessive use of ‘have’ only. At the time I was also using COHA however access to the dataset costs money and they don’t have an API to search it and produce machine-readable data meaning I had to semi-manually scrape the data by using their website’s search feature which I didn’t want to do again. I was able to produce a nice visualisation but it wasn’t useful for what I was investigating.
Recently, however, I was notified that Google had updated their ‘Ngram’ service to include data up to 2019 and they had also redesigned the interface so I thought this might be a good time to return to this and finally have a go at reproducing Zimmermann’s graph.
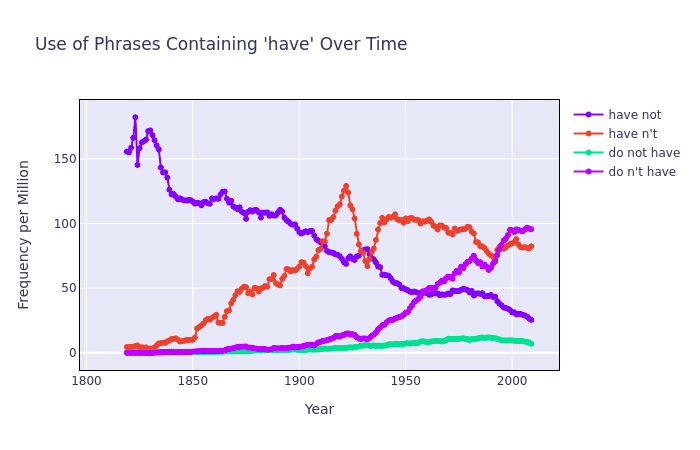
I put 2 queries into Google’s Ngram Viewer, the first being don't have _NOUN_ and the second being have not _NOUN_, Google Ngram treats don't have and do not have as the same sequence and does the same for have not and haven't so I didn’t have to deal with those separately which was quite useful.
From there, I downloaded the data which was formatted as JSON and wrote a python program to calculate the frequency don't have appears as a proportion of the total usage of possessive have and then plotted it on a graph. Once I had done this, I fitted the data to a logistic sigmoid curve using least squares and plotted the regression on the graph as well.
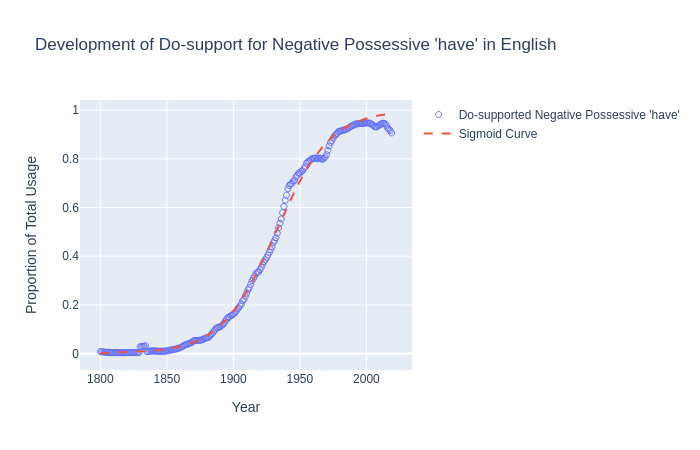
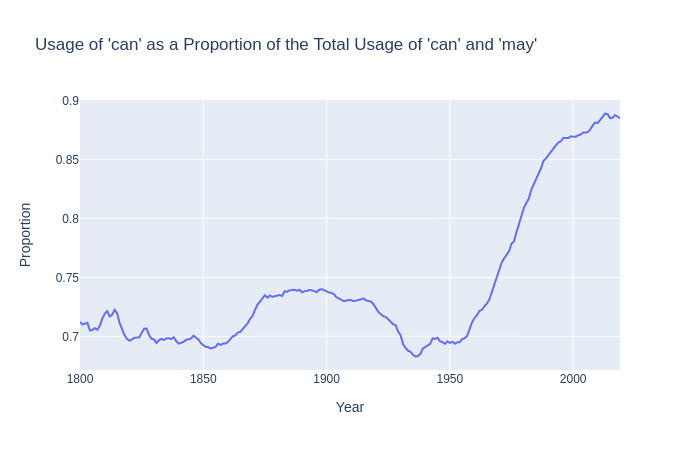
I was able to reproduce Zimmermann’s graph and I was quite happy with what I had made. I then proceeded to do something similar with may I and can I and found something quite interesting. The technique was pretty much the same, however I changed the queries to can _NOUN_ _VERB_ + can _PRON_ _VERB_ and can _NOUN_ _VERB_ + can _PRON_ _VERB_.
When I plotted the data I noticed that before 1850, usage of ‘can’ was steady at 0.7 which served as a reminder that can and may were both in use at the time but they had distinct meanings. However, after 1850, can starts to be used more, this might be due to the ‘can’ also being used in the same way as permissive ‘may’ and is what would be expected if it is indeed because of that. However, from there at sometime around 1917, ‘can’ starts to be used less and eventually returns to its baseline usage of around 0.7, this might be a result of proscription. However, at around 1950 ‘can’ starts to be used considerably much more and indeed its growth in usage seems to resemble a sigmoid curve.
I found looking at the data interesting and I also learned quite a bit about language change from Zimmerman’s paper, if I were to do this again I would have included the other conjugations of do in my data (i.e. does, doesn’t). I did a quick look at the ngram data and it looks the same however it seems as if the curve is shifted across the x-axis signalling that it may have undergone change at a slightly different time. If this is true then it would be interesting to investigate the time-lag as well.
In doing this I had fun collecitng and analysing the data and also sharing the results with friends. I also found out some very interesting pieces of information about language change.